How to Use Events in Demand Forecasting: New guide with Jupyter Notebook

The demand forecasting guide uses the Facebook Prophet to enable data scientists to identify the impact events have on demand and build more accurate forecasting models. Below is an excerpt and links to the full guide.
A key use of PredictHQ’s data is for use in demand forecasting. We provide APIs and tools for use in forecasting so you can model the impact of events on your demand. The goal is to increase your forecast accuracy by taking into account the impact of events on demand.
In this guide, we demonstrate how to use PredictHQ’s Aggregate Event Impact to improve the accuracy of a demand forecasting model. This guide shows you how to add features to your model that use the Aggregated Event Impact data.
We will first build a forecasting model using example customer demand data without events data as a baseline for comparison. We then incorporate our Aggregate Event Impact and holidays to build a second model with higher accuracy when predicting irregular demand spikes caused by events.
In this guide, we use the following open source technologies:
Jupyter notebook for live coding and visualization
Pandas library for data manipulation
Prophet library for demand forecasting from Facebook
Plotly for interactive visualization
See also our API doc on how to Retrieve Aggregate Event Impact for more details on Aggregate Event Impact.
You may also be interested in our getting started guide and correlation guide for data scientists. If you want to learn about our events data and learn how to correlate events with demand before diving into demand forecasting start with those guides.
Example Scenario
A hotel in Seattle has been performing demand forecasting using its historical data but found the model cannot predict the irregular demand spike patterns that may be caused by nearby events and holidays. They had found there is a correlation between their demand data and PredictHQ’s aggregate event impact shown by using this correlation guide. Therefore the next logical step is to incorporate Aggregate Event Impact (AEI) data into their forecasting model. After retraining their demand forecasting model using AEI and holiday data, an improvement in forecasting accuracy is observed.
Now let’s dive in and get started!
In the following sample code, we are going to show you how to use Facebook’s Prophet Opensource demand forecasting model to forecast future demand. First of all we will import a sample data set to get started with.In [1]:
import pandas as pd
import numpy as np
import plotly.graph_objects as go
# note: there an issues with prophet=0.5 and holidays=0.10.1
# follow here for a temp fix in hdays.py of the fbprophet package
# https://github.com/dr-prodigy/python-holidays/issues/277
from fbprophet import Prophet
Load demand data for 2017 to 2019In [2]:
# Load demand data
demand_ts = pd.read_csv('https://raw.githubusercontent.com/predicthq/phq-data-science-docs/master/demand-forecasting/demand_2017to2019.csv', index_col=0)
The data should look like the following: In [3]:
demand_ts.head()
Out[3]:
| DATE | DEMAND |
|---|---|
| 2017-01-01 | 208.67146 |
| 2017-01-02 | 173.002159 |
| 2017-01-03 | 231.782956 |
| 2017-01-04 | 240.631985 |
| 2017-01-05 | 250.908314 |
Let’s visualize the data.
In [4]:
fig = go.Figure([go.Scatter(x=demand_ts.index, y=demand_ts['demand'], name='demand')])
fig.update_layout(title='Figure 1: Demand')
fig.show()
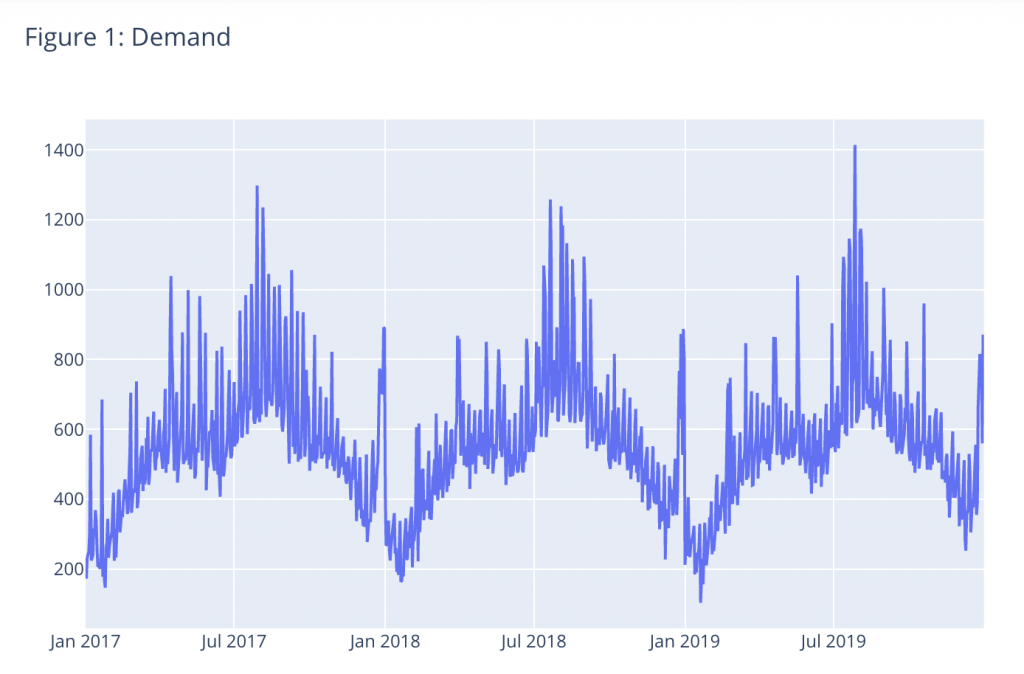
The diagram above shows three years of demand data that show strong seasonality and irregular demand spike patterns that may be caused by events such as holidays. Read the full guide in our Technical Documentation.